
Google Analytics now has native, drag-and-drop dashboards
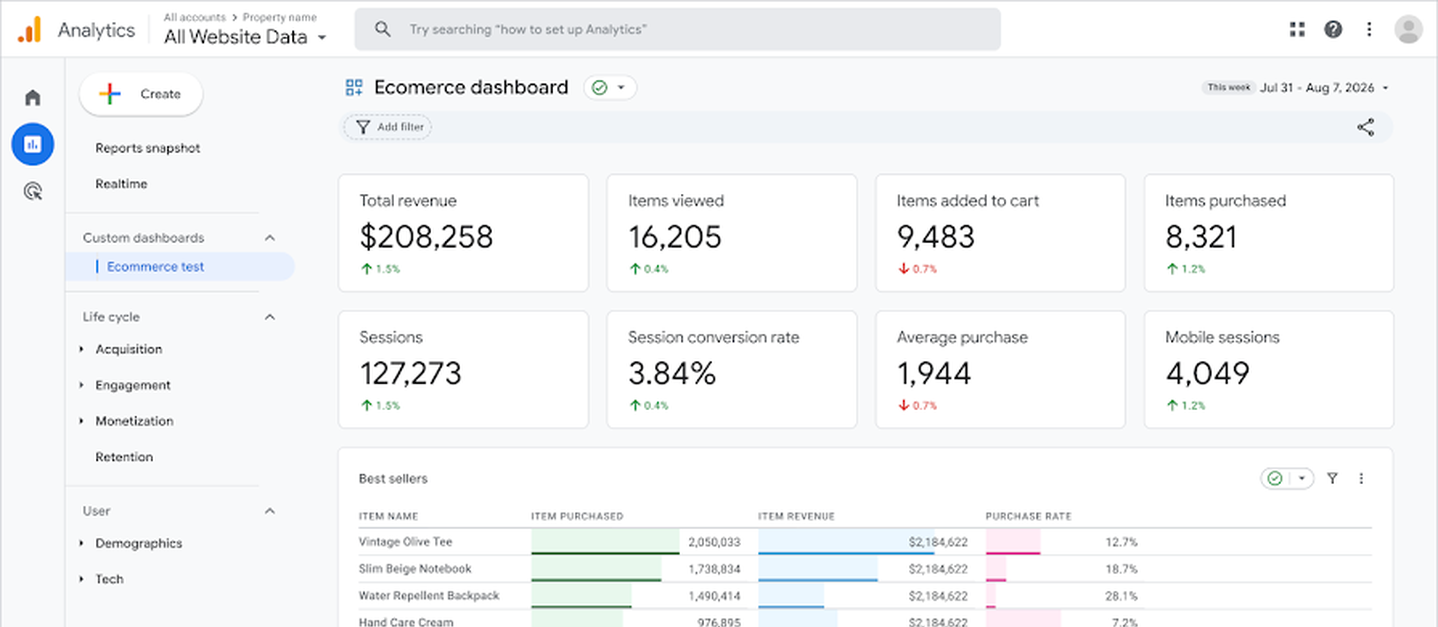
Google Analytics has recently added the ability to build your own custom drag-and-drop dashboards in Reports.
What it does
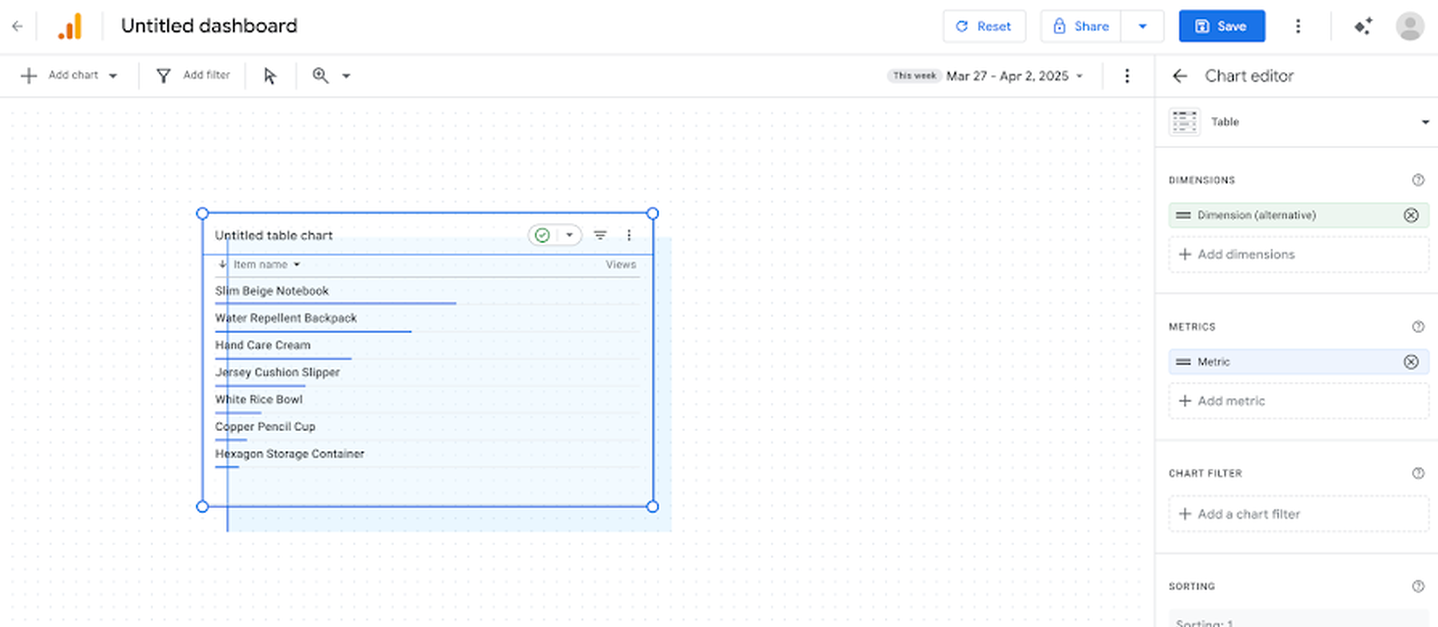
The new dashboard tool sits under Reports. Click + Create, then Dashboard, and you get a blank canvas you build with drag and drop. Six card types are supported: score cards for a headline KPI with a percentage change indicator, table charts with shaded values and pagination, line charts for a metric over time, bar charts (horizontal or vertical) for comparing dimensions, donut charts for part-to-whole splits, and funnel charts for tracking where users drop off in a conversion path.
You drag a visualisation type onto the canvas, then drag dimensions and metrics onto it, similar to the workflow in Explore reports. A right-hand panel lets you edit whichever card is selected. Once you’re happy with it, you save the dashboard, then publish it to add it to the Reports left navigation, where anyone with access to the property can view it.
Two screenshots from Google’s own help page show what this looks like in practice: building a dashboard on the canvas, and a finished published dashboard sitting in the left nav alongside the standard reports.
Access and permissions
Creating and publishing a dashboard needs Editor or Administrator access on the property. Anyone with any level of access can view a dashboard once it’s published. There’s no private, personal-view option described on Google’s help page. If you publish it, the whole property sees it.
The limits
Standard GA4 properties cap out at 15 cards per dashboard. GA4 360 (premium) properties get 30. A few things are missing that you’d expect from a proper BI tool: no API access to the dashboards themselves yet, no segment support, and no way to compare one card against another directly on the canvas.
GA4 Optimizer’s write-up, published a couple of weeks before Google’s own help page went live, adds a few more practical gaps to check before you build anything real on this. There’s no calculated metrics support and no regex filtering. There’s a bug where funnel chart cards ignore the metric you’ve actually selected. Exports are rough: PDF export clips long dashboards, exporting to Google Sheets doesn’t work, and a full-dashboard CSV export mixes together data from incompatible chart types. Data blending is limited to Google Ads. You can’t pull in a second, non-Google data source and combine it with GA4 data on the same card, which is one of the main reasons people reach for Looker Studio in the first place.
A word on Data Studio
It’s not going anywhere yet. What it’s good for is the everyday case: a KPI dashboard built entirely from GA4’s own data, without leaving the interface, without hitting the Data Studio connector’s API quota, and with access to a couple of GA4 metrics (Exits, Page Referrer) that the standard Data Studio connector doesn’t expose cleanly. What it’s not good for is anything that needs a second data source blended in, custom styling for a client-facing report, or scheduled distribution. If a client dashboard needs to combine GA4 with ad spend from three platforms and be emailed out every Monday morning, that’s still a Looker Studio job.
Rollout status
Google’s own help page doesn’t use the word beta, but it’s clearly still rolling out. GA4 Optimizer’s coverage, from late August 2026, describes it as “live in most active properties right now” rather than universally available, and doesn’t rule out further changes before Google calls it finished. If you open Reports in a given property and don’t see a + Create option yet, that’s expected. It’s the same gradual-rollout pattern Google’s used for other recent GA4 and GTM changes this year, not a sign you’re missing a setting somewhere.
What to actually do about it
Nothing urgent. If it’s live in your account, it’s worth a look for the simple case: a single dashboard someone on the team checks every morning, built entirely from GA4 metrics, that used to mean four open tabs. Don’t build anything that depends on blended data or a scheduled export yet. Finally, because publishing shares the dashboard with everyone who has access to the property, treat the first one you publish as a test, not a finished product you’re happy for the whole team to see immediately.
Newsletter
Occasional notes on data, tracking & AI-readiness
No spam, no growth-hacking. Just an email when there's something worth reading.