
Building a Firebase Analytics Error Tracking Dashboard
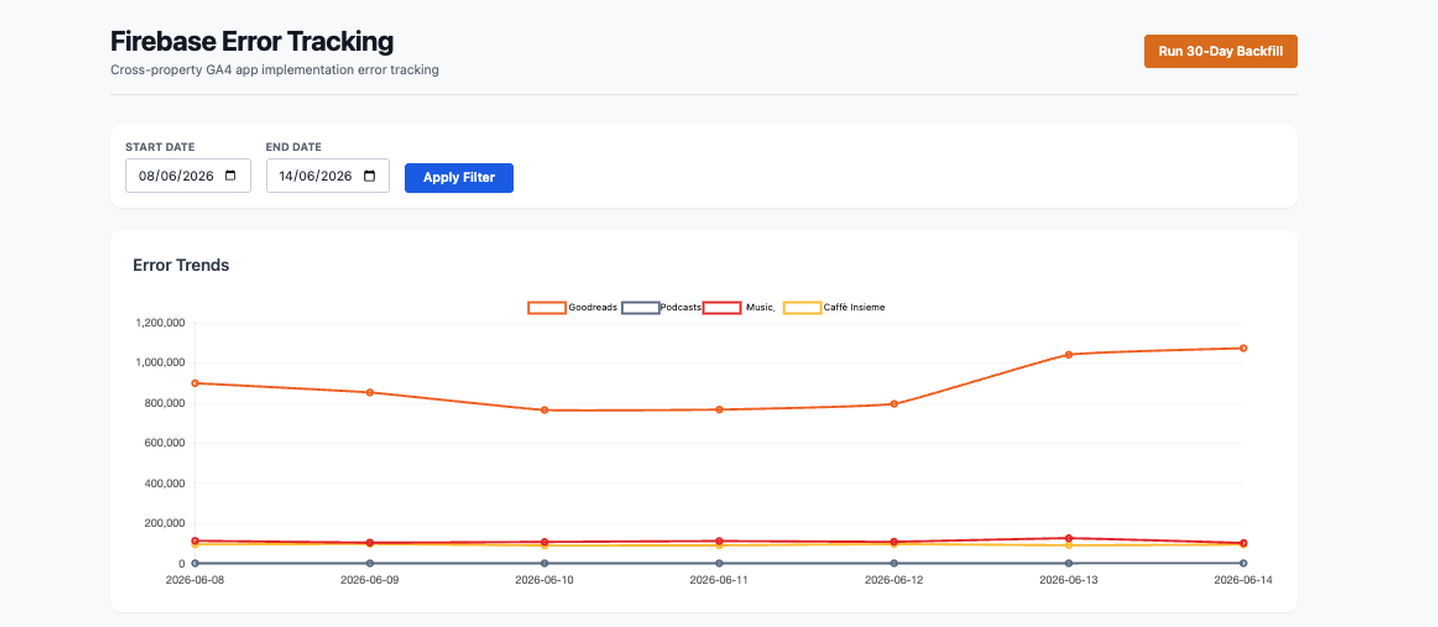
If you manage multiple mobile apps with Firebase Analytics, you have probably encountered the problem: the SDK logs implementation errors — invalid event names, parameter values that are too long, reserved property names — but there is no built-in view for tracking those errors across properties over time. Each error gets recorded as a firebase_error event in GA4, but pulling a meaningful trend out of that across multiple apps requires writing a BigQuery query every time.
I wanted a single place where I could see at a glance: which properties are throwing errors, which error codes are involved, and whether the count is going up or down.
How It Works
The pipeline runs in three stages: BigQuery → Cloud Functions → Firestore, with a frontend pulling directly from Firestore via the Firebase JS SDK.
BigQuery
Firebase Analytics exports all event data to BigQuery, including a firebase_error event parameter (param.key = 'firebase_error') whose integer value maps to a specific SDK error code. The query groups by date and error code for each property’s events_* table, using a date offset so that each run covers a rolling window. The same query powers both the daily sync and the manual backfill — the date range is just passed in as a variable, so switching between a 3-day rolling window and a full 30-day history is a matter of changing two numbers.
Cloud Functions
Two Cloud Functions handle the data sync:
- A scheduled function runs at 4am daily and syncs the previous 1–3 days. The 3-day window ensures that any data that arrives late in BigQuery (which is common with GA > BigQuery exports) is captured and corrected on subsequent runs.
- A callable function is triggered manually from the dashboard and runs a full 30-day backfill on demand — useful when setting up a new property or recovering from a sync gap.
Both functions write documents to the firebase_error_metrics Firestore collection, keyed by date_propertyName_errorCode, using a merge: true batch write so re-runs overwrite rather than duplicate.
If you are working across mutliple Google Cloud projects, you will need to add a Service Account User from the project this is being deployed on to the projects that have the BigQuery tables. This Service Account User will need BigQuery Data Viewer and BigQuery Job User.
Firestore
Each document is a flat record: date, propertyName, errorCode, and count. The flat structure means the frontend can filter and group client-side without complex queries — just a date-range where clause to load the relevant window, then JavaScript to pivot the data however the UI needs it.
The Dashboard
The frontend is plain HTML with Tailwind CSS and Chart.js, hosted on Firebase Hosting. You can, of course, host this elsewhere, whilst it is also advisable to add authentication to any internal dashboards.
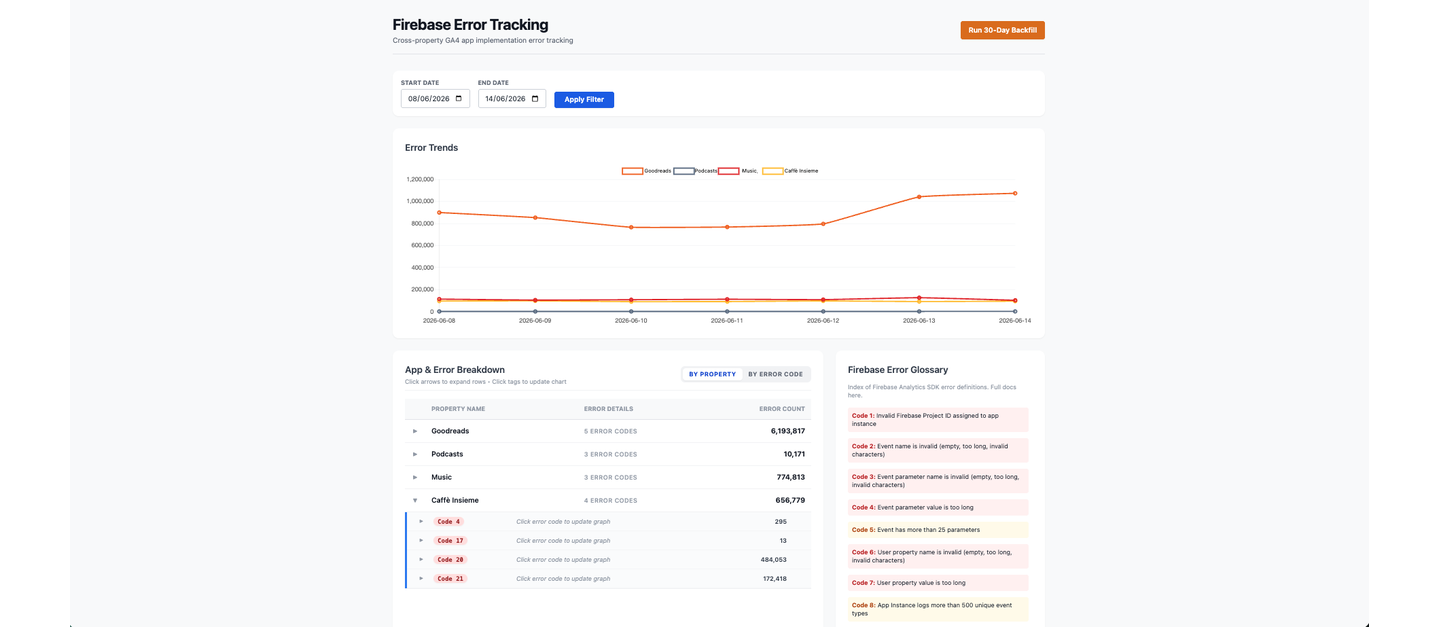
Date range filter — start and end date pickers default to the last 7 days. Clicking Apply Filter re-queries Firestore and redraws everything.
Error trend chart — a line chart showing daily error counts per property across the selected period. Clicking any error code tag in the breakdown table isolates that specific property/code combination in the chart, making it easy to see whether a spike is a one-off or a sustained regression. A Reset Filter button returns the chart to the full view.
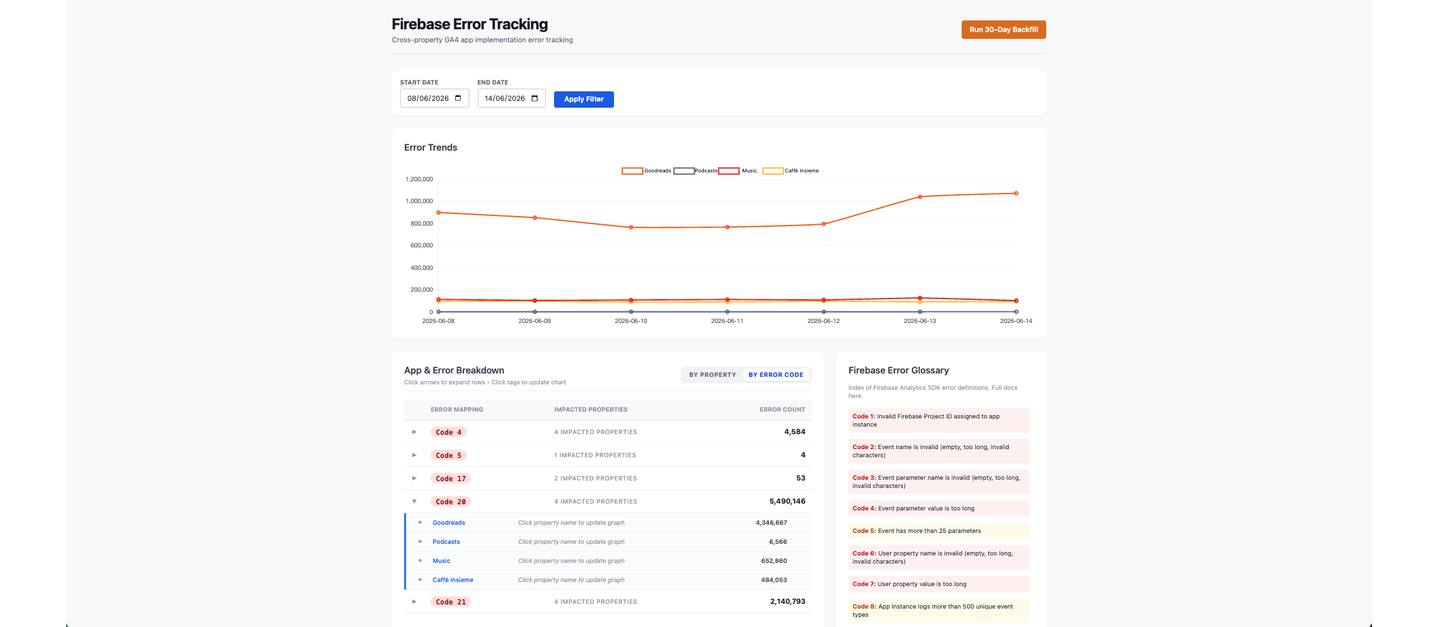
Breakdown table — the main data view. A segmented control toggles between two perspectives:
- By Property — top-level rows are properties, expandable to error codes, expandable again to individual dates.
- By Error Code — top-level rows are error codes, expandable to which properties are affected, then to individual dates.
Both perspectives show totals at each level and use a colour-coded expand/collapse tree so you can drill down exactly as far as you need without losing context.
Error code glossary — a sidebar panel listing all Firebase Analytics SDK error codes with plain-English descriptions, colour-coded by severity (red for hard errors, amber for warnings, grey for informational, blue for technical). Having this inline means you never need to leave the dashboard to decode what an error means.
Why It’s Useful
The value is not in any individual query, it is in having the data always available and pre-aggregated. When an error code spikes on a particular property, you want to know about it as soon as possible, not the next time someone thinks to check. With the daily sync running automatically, the dashboard is always up to date, and because it stores historical data in Firestore rather than querying BigQuery on demand, it is fast even across a large date range.
The two-perspective breakdown table was the feature that proved most useful in practice. Starting from the error code view lets you immediately answer “how widespread is this error?”; if a code is hitting only one property, it is a local implementation issue; if it is hitting all of them, it points to something in a shared library or SDK version. Starting from the property view lets you answer “what is going wrong with this particular app?” and prioritise which errors to fix first.
The dashboard code is available on GitHub. You can easily copy the code into your own hosting, and update the parameters where relevant such as firebaseConfig and the BigQuery tables array.
Hopefully you found the above useful - do not hesitate to reach out with any questions.
Newsletter
Occasional notes on data, tracking & AI-readiness
No spam, no growth-hacking. Just an email when there's something worth reading.