
Automated Contract Usage Dashboard
Dashboard allowing companies and agencies to easily see their analytics usage across a number of platforms and properties.
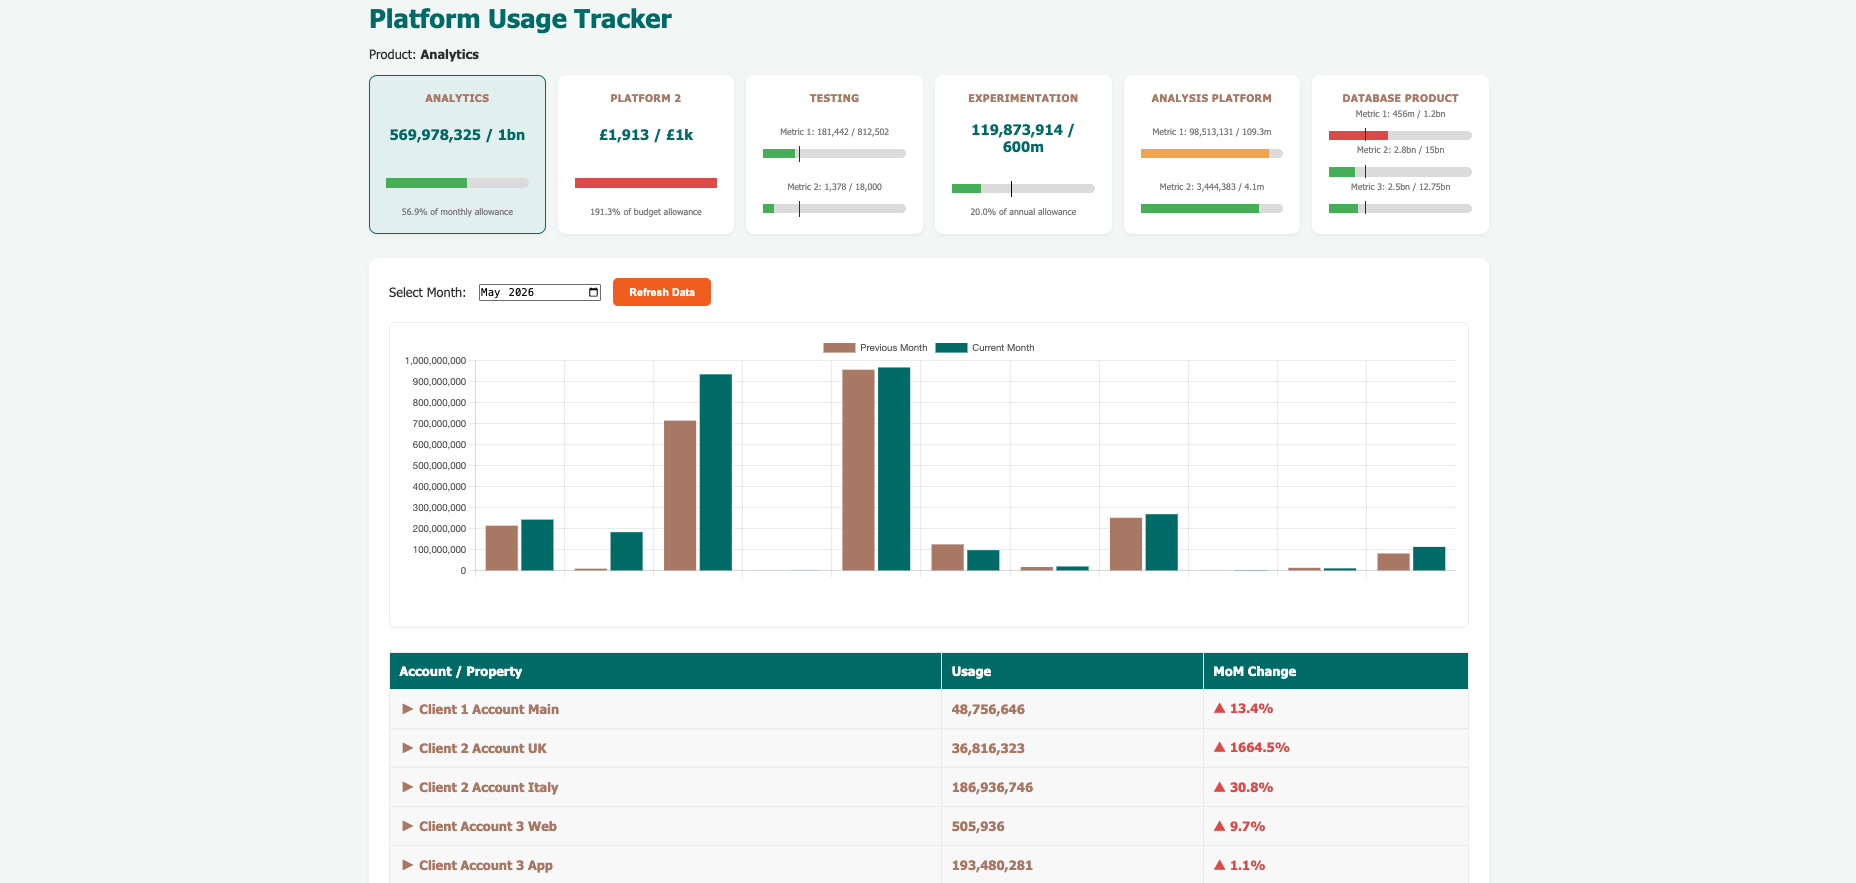
One of the persistent problems when managing a portfolio of analytics and measurement platforms is knowing whether you’re on track with your contract usage. Renewals or limits are annual, invoices arrive months after the fact, and by the time you realise you’ve over or under used a platform, or are on course to reach your limit, it’s too late to act. This dashboard was built to fix that; consolidating contract usage data across multiple platforms into a single, always-current view.
The Problem
When a team relies on several different measurement and analytics vendors, each platform has its own contract terms, billing cycles, and reporting interfaces. Getting a consolidated picture of usage means logging into multiple portals, exporting data manually, and doing mental arithmetic against contract limits. The dashboard removes all of that friction.
What Was Built
The hub is built on Firebase, using Cloud Functions v2 (Node.js 22) as the backend, Firestore for storage and caching, Firebase Storage for file uploads, and Firebase Auth with Google SSO for access control.
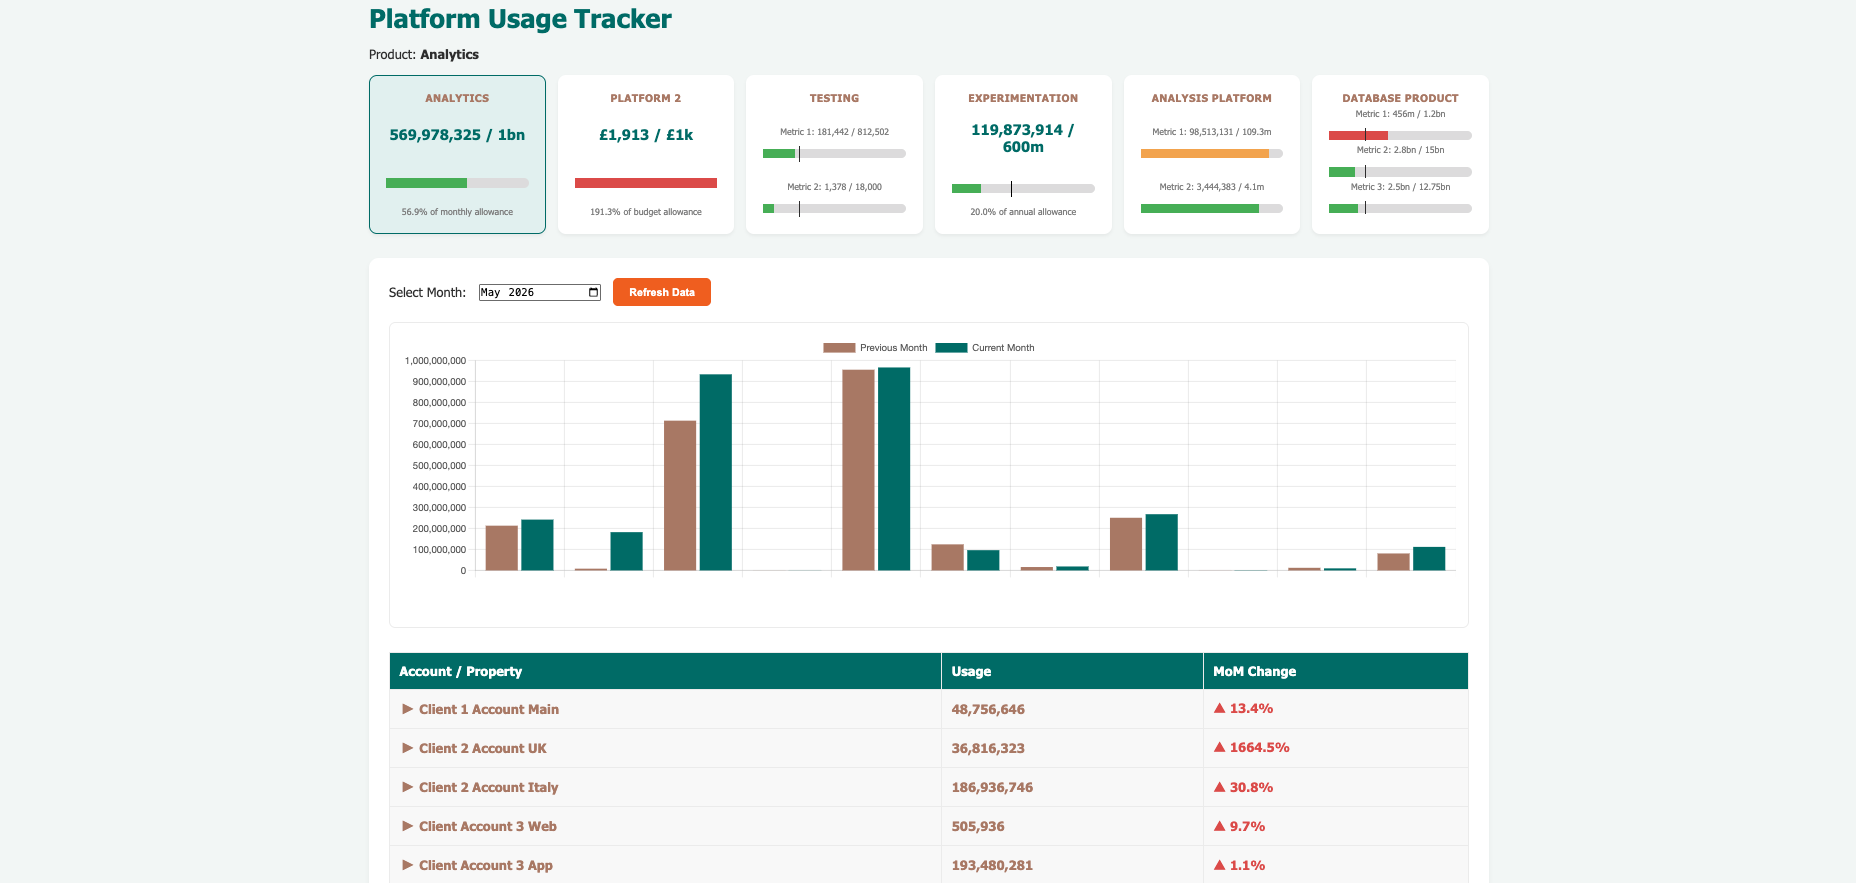
API-based platforms: For platforms that expose usage data via an API, Cloud Functions fetch the data directly, parse it, and serve it to the frontend. Each platform has its own billing cycle and contract terms, so the pacing logic is tailored accordingly, tracking usage against annual allowances and flagging whether consumption is on track relative to the percentage of the contract year elapsed. Data is broken down with month-on-month comparisons throughout. Usage limits are simply set as one variable which is then referenced for monthly and annual calculations.
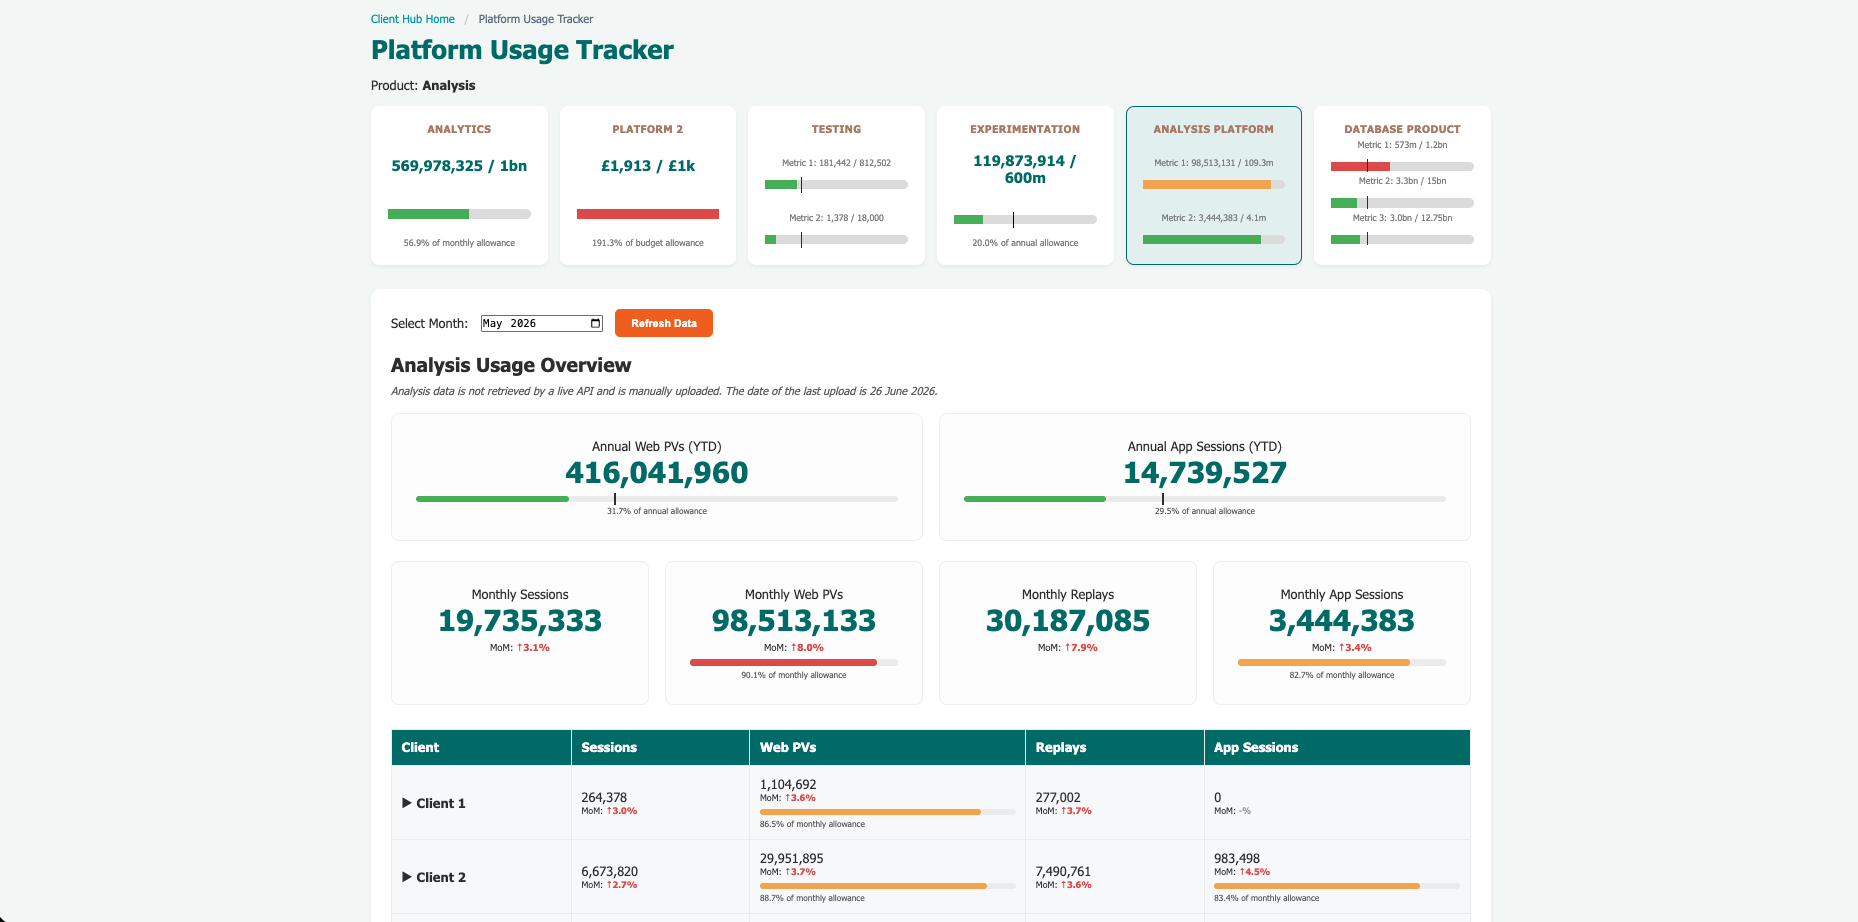
CSV upload pipeline: Not every platform exposes usage data through a usable API (some even charge for the privilege!). For those that don’t, the dashboard uses a CSV upload pipeline: a team member downloads the usage report from the vendor portal and uploads it directly to the dashboard. Firebase Storage triggers an onObjectFinalized Cloud Function, which parses the CSV using csv-parser, calculates month-on-month changes, and writes the results to Firestore. From that point the data is served identically to the API-based platforms — the end user sees no difference.
Caching Strategy
One of the key design decisions was how to balance data freshness with speed and API rate limits. The approach uses a two-tier cache:
For historical months, data is permanently archived to Firestore via scheduled Cloud Functions. Archived data is served with a 24-hour Cache-Control header — there’s no need to re-fetch something that can’t change.
For the current month, data is fetched live from each platform’s API and served with a 3-hour cache. This keeps the dashboard feeling current without hammering vendor APIs on every page load, whilst also allowing for data to load quickly.
Tech Stack
- Firebase Cloud Functions v2 (Node.js 22)
- Cloud Firestore — storage, caching, and monthly archives
- Firebase Storage — CSV upload pipeline
- Firebase Auth — Google SSO with domain-based access control
- csv-parser — CSV upload processing
- axios — HTTP client for vendor API calls